Help
Map Resolution
This map is best viewed on monitors with a 1280 x 800 pixel resolution.
General Map Controls
The General Map Controls are located at the top of the map, just below the site navigation.
Pan Tool

To view different areas of the map, use the arrows on the Pan Tool to move the map in any direction. You also can move the map by placing the cursor over the map. When the cursor appears as a hand, hold either mouse button down to "grab" the map and move it to the area you wish to view. Release the mouse button to release the map.
Zoom Out/In

Zoom out or in on the map using either the slider or the -/+ magnifying glasses.
Map Type
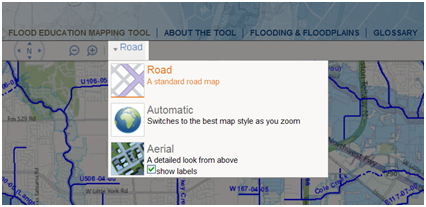
Use these options to change how the map displays. Click:
Road (default): The map displays as a standard road map.
Automatic: The map switches automatically between road and aerial views.
Aerial: The map displays as a satellite image map. If "show labels" is checked, roads will be labeled on the map.
Flood Education Mapping Tool Features
Address Search
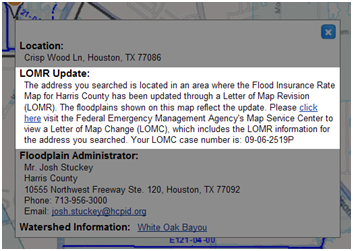
To view floodplain information for your home, business or other location, enter a street address, city and state in the address search field and click the "Find" button. The map will zoom to that address and display a pin and a text window. The text window will show the address you entered, the local floodplain administrator's contact information and a link to information about the watershed. If the address entered is located within a Letter of Map Revision (LOMR) area, the text window will provide a link to the Federal Emergency Management Agency’s (FEMA) Map Service Center. There, users can view LOMR information using a Letter of Map Change (LOMC) case number, which is provided in the text window.
Map View Options
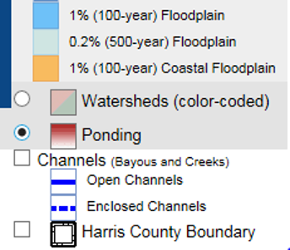
Mapped Floodplains
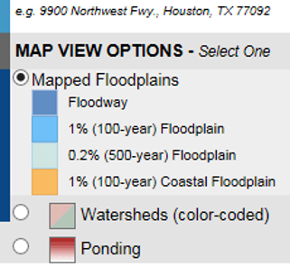
This legend item is one of three mutually exclusive map view options. Users can only select one of the following map view options at a time: Mapped Floodplains, Watersheds (color-coded) and Ponding. The Mapped Floodplains legend option displays the Floodway, 1% (100-year) Floodplain, 0.2% (500-year) Floodplain and 1% (100-year) Coastal Floodplain.
The mapped floodplains shown on the Flood Education Mapping Tool are the floodplains delineated on the Federal Emergency Management Agency’s (FEMA) Flood Insurance Rate Map (FIRM or floodplain map) for Harris County that was adopted in June 2007 by the city of Houston, unincorporated Harris County and the 33 municipalities of Harris County. In addition, the floodplains shown on this map reflect updates, or modifications, made through a Letter of Map Revision (LOMR) to the FIRM since its 2007 adoption. A LOMR is a modification, by letter, made to a FEMA FIRM, generally based on changes that affect the topography of land and hydrologic or hydraulic characteristics of a flooding source, and thus result in the modification of floodplains, floodways or Base Flood Elevation.
Watersheds (color-coded)
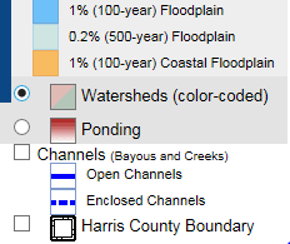
This legend item is one of three mutually exclusive map view options. Users can only select one of the following map view options at a time: Mapped Floodplains, Watersheds (color-coded) and Ponding. The Watersheds (color-coded) legend option represents the 22 major watersheds in Harris County. A watershed is a geographical region that drains to a common bayou, creek or other waterway. Color-coding has been used on the Flood Education Mapping Tool to distinguish between watersheds.
Ponding
This legend item is one of three mutually exclusive map view options. Users can only select one of the following map view options at a time: Mapped Floodplains, Watersheds (color-coded) and Ponding. The Ponding legend option represents ponding, which is the collection of stormwater on streets or on undeveloped land that typically forms when rainfall occurs exceeding the design capacity of a street’s drainage system or exceeding the land’s ability to drain. On this mapping tool, the shade of red indicates the depth of the water. Dark red indicates deep ponding and light red indicates shallow ponding.
Channels (Bayous and Creeks)
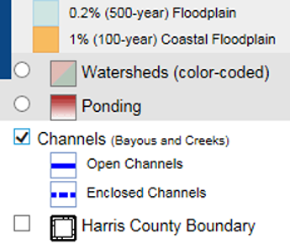
This legend item represents channels, a generic term used by the Harris County Flood Control District in reference to bayous, creeks, small tributaries and some ditches. When identifying channels, the Flood Control District uses a combination of letters and numbers to help easily identify the location of a waterway. On this mapping tool, channels have been labeled with the formal identification numbers used by the Flood Control District. The Flood Education Mapping Tool differentiates between open and enclosed channels. An open channel is an in-ground channel, such as a bayou or a creek, and is represented by a solid blue line. An enclosed channel is typically underground and contained in large box culverts and is represented by a dashed blue line.
Harris County Boundary
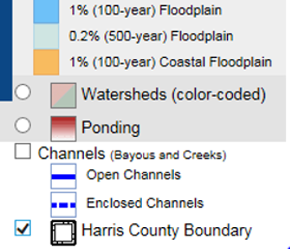
This legend item represents the Harris County boundary, a line shown on a map to indicate the boundary of Harris County, Texas. This mapping tool only shows floodplains for areas within Harris County. The Harris County boundary will always appear on the map and cannot be turned off.
Reset to County-Level View
Clicking on "Reset to County-Level View" will reset the map to the original view of Harris County that is displayed when the tool is first opened.